Abstract
Objective
The aim of this study was a sub-analysis of the FARBEN survey to compare the preferences and responses of participants from the Eastern and Western German federal states and to identify potential differences.
Material and Methods
The preferences of the German participants from the respondents in the tri-national FARBEN study were analyzed. Participation was voluntary and anonymous. The questionnaire consisted of 62 questions covering topics such as the workplace in general, work-time models, and professional goals. In the present study, only the data of the participants working in Germany were analyzed.
Results
The sub-group consisted of 1,021 out of the total of 1,364 (74.85%) respondents for the FARBEN survey. Of these, 855 (83.7%) responses were from participants from the Western federal states, and 166 (16.3%) from the Eastern federal states. Gynecologists in the East generally became parents at a younger age (29.3 vs. 30.8 years) and the rate of childlessness was higher among gynecologists in the West (54.8% vs. 37.0%). In the West, full-time work was both more frequently preferred (13.0% vs. 5.4%) and practiced (52.1% vs. 41.5%).
Conclusion
Many family policy aspects of the former German Democratic Republic facilitated and continues to facilitate the compatibility of work and family life for mothers in the East. Historical perspectives can be helpful in implementing improvements for women in terms of work-family balance in a female-dominated medical field such as gynecology.
Keywords: Career goals, equal opportunities, gender differences, working time models, Eastern Germany, Western Germany
Introduction
The “FARBEN” survey (German: “Colors”; FAvorisierte aRBEitszeitmodelle in der GyNäkologie = Preferred Working Time Models in Gynecology) examined preferences regarding working hours and other professional policy topics, such as gender equality, parental leave, and availability and capacity to attend sabbaticals (). The first survey collected and compared country-specific aspects of medical training in each respective country (, ). A total of 1,364 (trainee) gynecologists and students with a focus on gynecology participated in the FARBEN survey. There have been relatively few publications in this field to date and the FARBEN survey represents the largest collected database in gynecology on the topic (-).
The reunification of Germany in 1989 was driven by peaceful protests in East Germany, economic struggles, and political changes in the Soviet Union, leading to the fall of the Berlin Wall on November 9. This event paved the way for the official reunification on October 3, 1990, when East and West Germany became one country again: the Federal Republic of Germany. In the former German Democratic Republic (GDR; “East Germany”), employment of mothers and single parents was actively promoted due to both economic and ideological factors (). This was reflected in the widespread availability of childcare facilities, as well as additional vacation days and reduced weekly working hours with full salary compensation for mothers with multiple children, in order to support women when balancing work and family life. The coverage rate for childcare facilities for children under the age of 3 years nationwide was 80% (at that time, the highest rate of early childhood care worldwide), while kindergarten places were provided for 94% of children until the end of the former GDR and after-school care was available for 82% of children. In comparison, in 1990, the Western federal states offered childcare facilities for younger children (≤3 year old) for 2%, kindergarten care for 78%, and after-school care for 4% of schoolchildren ().
In 2017, a survey of female employment reported that 57% of mothers with young children living in the Western federal states were employed, compared to 72% in the Eastern (sometimes referred to as “new”) federal states. Similarly, a significant difference in full-time employment among mothers with young children was observed, with 9% in the West compared to 24% in the East (). These differences were attributed to persistent cultural, societal, and political influences ().
The aim of the present study was to evaluate the data from the FARBEN survey, taking into account these historical aspects, with regard to the similarities and differences in preferences related to professional policy issues in the East and West of the Federal Republic of Germany.
Material and Methods
The following provides an overview of the questionnaire and the survey, in accordance with the Checklist for Reporting Results of Internet E-Surveys ().
Participation was entirely anonymous. Multiple responses from the same participant were excluded through IP address verification. The survey was aimed at all gynecologists, including residents, specialists, senior physicians, chief physicians, gynecologists in private practice, and medical students pursuing a career in gynecology and obstetrics. By participating in the online survey, participants provided informed consent for their involvement in the study as well as for the anonymous publication of the resulting data. This study was approved by the University of Lübeck in Germany (approval number: 2023-644, date: 20.09.2023). The survey response period was between October 2023 and May 2024.
In this sub-analysis, only the data of participants from Germany were evaluated and divided into two groups: the Western federal states and the Eastern federal states of the Federal Republic of Germany. It is important to note that all participants from Berlin were classified as belonging to the Eastern federal states.
Recruitment and survey invitations
Participants were recruited through the social media channels of the young forums/young gynecology groups (e.g., Instagram), print media (), educational courses and conferences, newsletters of the respective national gynecological societies, and during lectures for medical students. Due to these recruitment methods, the participants constitute a convenience sample rather than a randomly selected, representative group of gynecologists. The completion rate, defined as the number of participants submitting the final page of the questionnaire divided by the number of participants who agreed to take part, was 87.8% (896 out of 1,021 participants). All questionnaires, including those from participants who terminated early, were included in the analysis.
Questionnaire
The questionnaire is described in detail elsewhere (). The survey is a self-developed, non-validated instrument. It was designed by consensus amongst representatives of the Young Boards and Colleges of Obstetrics and Gynecology of Germany, Austria and Switzerland (NT, NA, PF, AK, CB, RK), under the mentorship of Prof. Dr. Maggie Banys-Paluchowski (University Hospital Schleswig-Holstein, Lübeck Campus) and the Equality Officer of the University of Lübeck (Dr. Solveig Simowitsch). In addition, advisory support was provided by Prof. Dr. Barbara Schmalfeldt, Past-President of the German Board and College of Obstetrics and Gynecology.
The questionnaire was created using the online platform “SurveyMonkey” as an “open survey”, open for each visitor of a site, and was available in three languages, German, Italian, and French, allowing participants to respond in their preferred language. It comprised a total of 62 questions, 54 of which () were presented to all respondents, regardless of nationality. Answering all questions was mandatory, preventing participants from skipping any items without providing a response (completeness check). Most questions included a non-response option, such as “not applicable” or “prefer not to say,” allowing participants to refrain from committing to an answer when unsure. Respondents were able to change their answers up to the final submission of the questionnaire.
Statistical analysis
Data analysis was conducted using Excel 2311 and SPSS, version 29 (IBM Inc., Armonk, NY, USA). Multiple entries by the same individuals were excluded through anonymous IP address verification. Correlations between two factors were examined using the chi-square test, with p-values <0.05 considered statistically significant. All reported p-values are two-sided. A binary logistic regression was conducted to examine the influence of gender (male/female) and workplace region (Eastern/Western Germany) on the likelihood of pursuing a chief physician career or a habilitation (highest university degree in German-speaking countries). The model included gender, region, and their interaction term as independent variables, with the career goal (chief physician/habilitation vs. other) as the dependent variable. Odds ratios and predicted probabilities were analyzed to assess the statistical significance and effect sizes of each factor.
Results
Participant characteristics
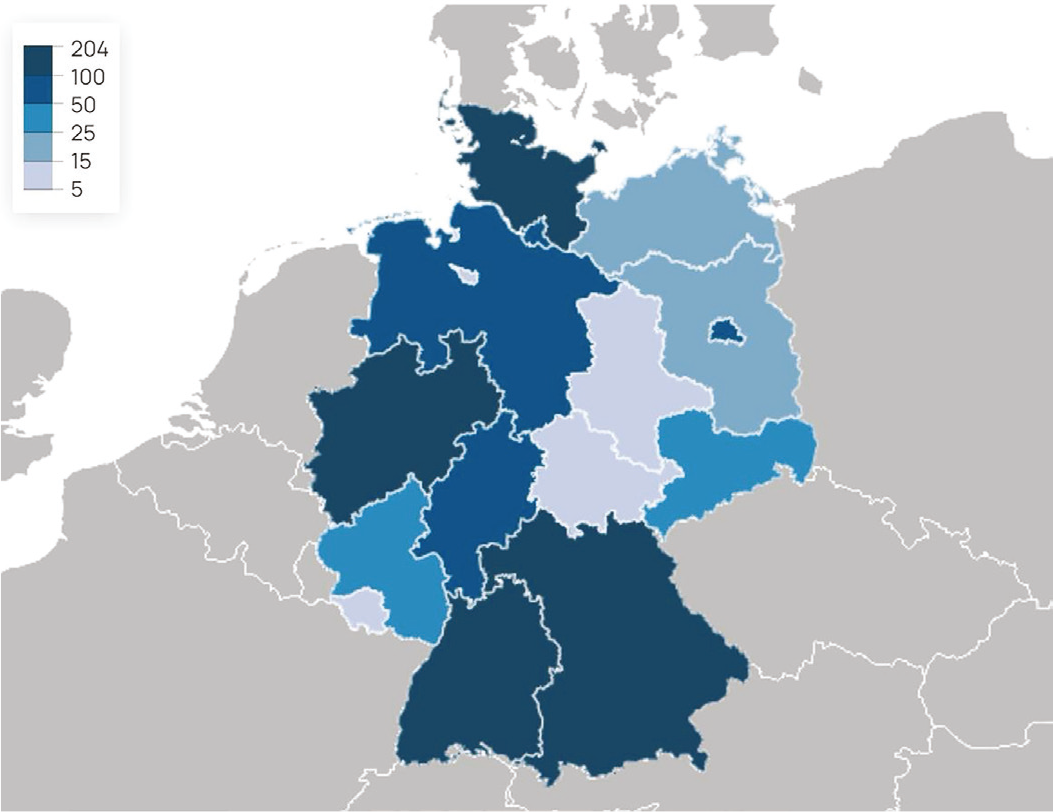
Of the total of 1,364 FARBEN survey participants, 1,021 (74.85%) worked in Germany. In the Western federal states, the number of participants was 855 (83.7%), while 166 (16.2%) worked in the Eastern federal states. The federal state with the highest number of participants from the West was Bavaria, with 204 participants (20.0%). From the Eastern federal states, the majority of participants (63; 38.0%) were from the city-state of Berlin (, ). In the Eastern federal states, 159 women (95.8%), 6 men (3.6%), and one non-binary person (0.6%) participated. In the Western federal states, a total of 769 women (89.9%), 85 men (9.9%), and one non-binary person (0.1%) participated in the survey.
Table 1. Participants of the FARBEN survey from the Western and Eastern federal states of the Federal Republic of Germany
Questions | Number of inhabitants (in millions) | Western part of Germany | Eastern part of Germany |
|---|---|---|---|
Total | - | 1,021 (100%) | |
In which federal state do you work/study? | - | 855 (83.7) | 166 (16.2) |
Baden-Wuerttemberg | 11.2 | 120 (14.0) | - |
Bavaria (Bayern) | 13.2 | 204 (23.9) | - |
Berlin | 3.7 | - | 63 (38.0) |
Brandenburg | 2.6 | - | 24 (14.5) |
Bremen | 0.7 | 13 (1.5) | - |
Hamburg | 1.9 | 72 (8.4) | - |
Hesse (Hessen) | 6.3 | 63 (7.3) | - |
Mecklenburg Western Pomerania (Mecklenburg Vorpommern) | 1.6 | - | 24 (14.5) |
Lower Saxony (Niedersachsen) | 8.0 | 56 (6.5) | - |
Northrhine-Westphalia (Nordrhein-Westfalen) | 18.0 | 171 (20.0) | - |
Rhineland Palatinate (Rheinland-Pfalz) | 4.1 | 32 (3.7) | - |
Saarland | 1.0 | 5 (0.6) | - |
Saxony-Anhalt (Sachsen-Anhalt) | 2.1 | - | 13 (7.8) |
Saxony (Sachsen) | 4.1 | - | 35 (21.1) |
Schleswig-Holstein | 3.0 | 119 (13.9) | - |
Thuringia (Thüringen) | 2.1 | - | 7 (4.2) |
Career goals
Significant differences (p=0.032) were observed regarding professional goals in the East and West. In particular, there was a higher preference in employed positions for outpatient care in the East (23.5% vs. 14.6% in the West), while self-employed outpatient work was more favored in the West (24.8% vs. 19.9% in the East). A senior physician position was preferred more in the West (37.5%) than in the East (31.9%). Among those who did not pursue a hospital career, the reasons given for wishing to work in outpatient setting included night and weekend shifts (84.4%), insufficient compatibility of family and work (75.3%), and too little work-life balance (68.9%), irrespective of if the respondent was in the East or West. Regarding the goal of obtaining a scientific habilitation (i.e., the highest academic degree in German-speaking countries), there were no significant differences (East: 13.1%; West: 13.8%) ().
Table 2. Professional objectives and career, categorized by federal state
Questions | Total*: n (%) | Western part of Germany | Eastern part of Germany | p-value |
|---|---|---|---|---|
What is your current further education/professional position? | 1021 (100.0) | 855 (83.7) | 166 (16.2) | 0.040 |
Student | 86 (8.5) | 80 (9.4) | 6 (3.6) | - |
Resident 1st year | 77 (7.5) | 65 (7.6) | 12 (7.2) | - |
Resident 2nd year | 78 (7.7) | 60 (7.0) | 18 (10.8) | - |
Resident 3rd year | 131 (12.8) | 109 (12.7) | 22 (13.3) | - |
Resident 4th year | 124 (12.1) | 100 (11.7) | 24 (14.5) | - |
Resident 5th year | 137 (13.4) | 118 (13.8) | 19 (11.4) | - |
Resident 6th year | 42 (4.1) | 30 (3.5) | 12 (7.2) | - |
Resident >6th year | 18 (1.8) | 14 (1.6) | 4 (2.4) | - |
Specialist physician | 154 (15.1) | 124 (14.5) | 30 (18.1) | - |
Senior physician | 117 (11.5) | 103 (12.0) | 14 (8.4) | - |
Chief physician | 11 (1.1) | 11 (1.3) | 0 (0.0) | - |
Gynaecologist in outpatient practice | 46 (4.5) | 41 (4.8) | 5 (3.0) | - |
Your professional goal is this position | 1021 (100.0) | 855 (83.7) | 166 (16.2) | 0.032 |
Chief physician | 57 (5.6) | 50 (5.8) | 7 (4.2) | - |
(Leading) senior physician | 374 (5.2) | 321 (37.5) | 53 (31.9) | - |
Employed medical specialist in the hospital | 119 (11.7) | 94 (11.0) | 25 (15.1) | - |
Employed in outpatient practice | 164 (16.1) | 125 (14.6) | 39 (23.5) | - |
Self-employed in outpatient practice | 245 (24.0) | 212 (24.8) | 33 (19.9) | - |
Other (please specify) | 62 (6.1) | 53 (6.2) | 9 (5.4) | - |
Why would you not like to work in the hospital long-term? (1) (multiple answers possible) | 471 (100.0) | 390 (82.8) | 81 (17.2) | 0.068 |
Too much responsibility | 53 (13.0) | 46 (13.6) | 7 (9.7) | - |
Too high workload | 245 (59.9) | 198 (58.8) | 47 (65.3) | - |
Too little work/life balance | 282 (68.9) | 235 (69.7) | 47 (65.3) | - |
Insufficient compatibility of family/work | 308 (75.3) | 255 (75.7) | 53 (73.6) | - |
Night and weekend shifts | 345 (84.4) | 284 (84.3) | 61 (84.7) | - |
Duties in the delivery room | 115 (28.1) | 97 (84.3) | 18 (25.0) | - |
Financially unattractive | 71 (17.4) | 68 (20.2) | 3 (4.2) | - |
Inflexible working hours | 215 (52.6) | 181 (84.2) | 34 (47.2) | - |
Your workplace | 1008 (100.0) | 847 (84.0) | 161 (16.0) | 0.003 |
University hospital, department of gynecology | 265 (26.3) | 234 (27.6) | 31 (19.3) | - |
Non-university women’s department with a total of >25 physicians | 176 (17.5) | 146 (17.2) | 30 (18.6) | - |
Non-university women’s department with a total of 15-25 physicians | 243 (24.1) | 202 (23.8) | 41 (25.5) | - |
Non-university women’s department with a total of <15 physicians | 139 (13.8) | 104 (12.3) | 35 (21.7) | - |
Outpatient practice** (employed) | 73 (7.2) | 57 (6.7) | 16 (9.9) | - |
Outpatient practice** (self-employed) | 36 (3.6) | 33 (3.9) | 3 (1.9) | - |
Student | 60 (6.0) | 57 (6.7) | 3 (1.9) | - |
Other (combination of outpatient and hospital etc....) | 16 (1.6) | 14 (1.7) | 2 (1.2) | - |
Your highest academic title is | 909 (100.0) | 764 (84.0) | 145 (16.0) | 0.077 |
Master‘s degree | 55 (6.1) | 51 (6.7) | 4 (2.8) | - |
Doctorate | 540 (59.4) | 450 (58.9) | 90 (62.1) | - |
Habilitation | 11 (1.2) | 11 (1.4) | 0 (0.0) | - |
Professorship | 13 (1.4) | 13 (1.7) | 0 (0.0) | - |
You do not have an academic title | 290 (31.9) | 239 (31.3) | 51 (35.2) | - |
You would like to achieve habilitation (2) | 885 (100.0) | 740 (83.6) | 145 (16.4) | 0.974 |
Yes | 121 (13.7) | 102 (13.8) | 19 (13.1) | - |
No | 584 (66.0) | 488 (65.9) | 96 (66.2) | - |
You do not know yet | 180 (20.3) | 150 (20.3) | 30 (20.7) | - |
Only respondents whose professional goal was to work in an outpatient practice were asked this question
Habilitation = highest university degree in German-speaking countries; only respondents without habilitation/professorship were asked this question
*The differing number of total responses per question is due to the fact that participants were able to skip questions or prematurely end the survey
**And other similar outpatient areas for physicians
Regarding the analysis of the influence of both gender (male vs. female) and workplace region (Eastern vs. Western parts of Germany), no significant associations were found in the binary logistic regression for the career goal of attaining a chief physician position (p=0.619) or obtaining a habilitation (p=0.654). In East Germany, 12.8% of female participants reported wanting to attain habilitation, compared to 11.2% in West Germany (p=0.698). The proportion of male respondents wishing to obtain habilitation was 33.3% in the East and 43.3% in the West (p=0.240). Regarding clinical career goals, 3.1% of female respondents from Eastern federal states reported their professional goal to be the chief physician position, compared to 3.6% in the West (p=0.758). For male participants, the proportion was similar between East and West (33.3% and 25.9%, respectively, p=0.689).
Family time off and childcare
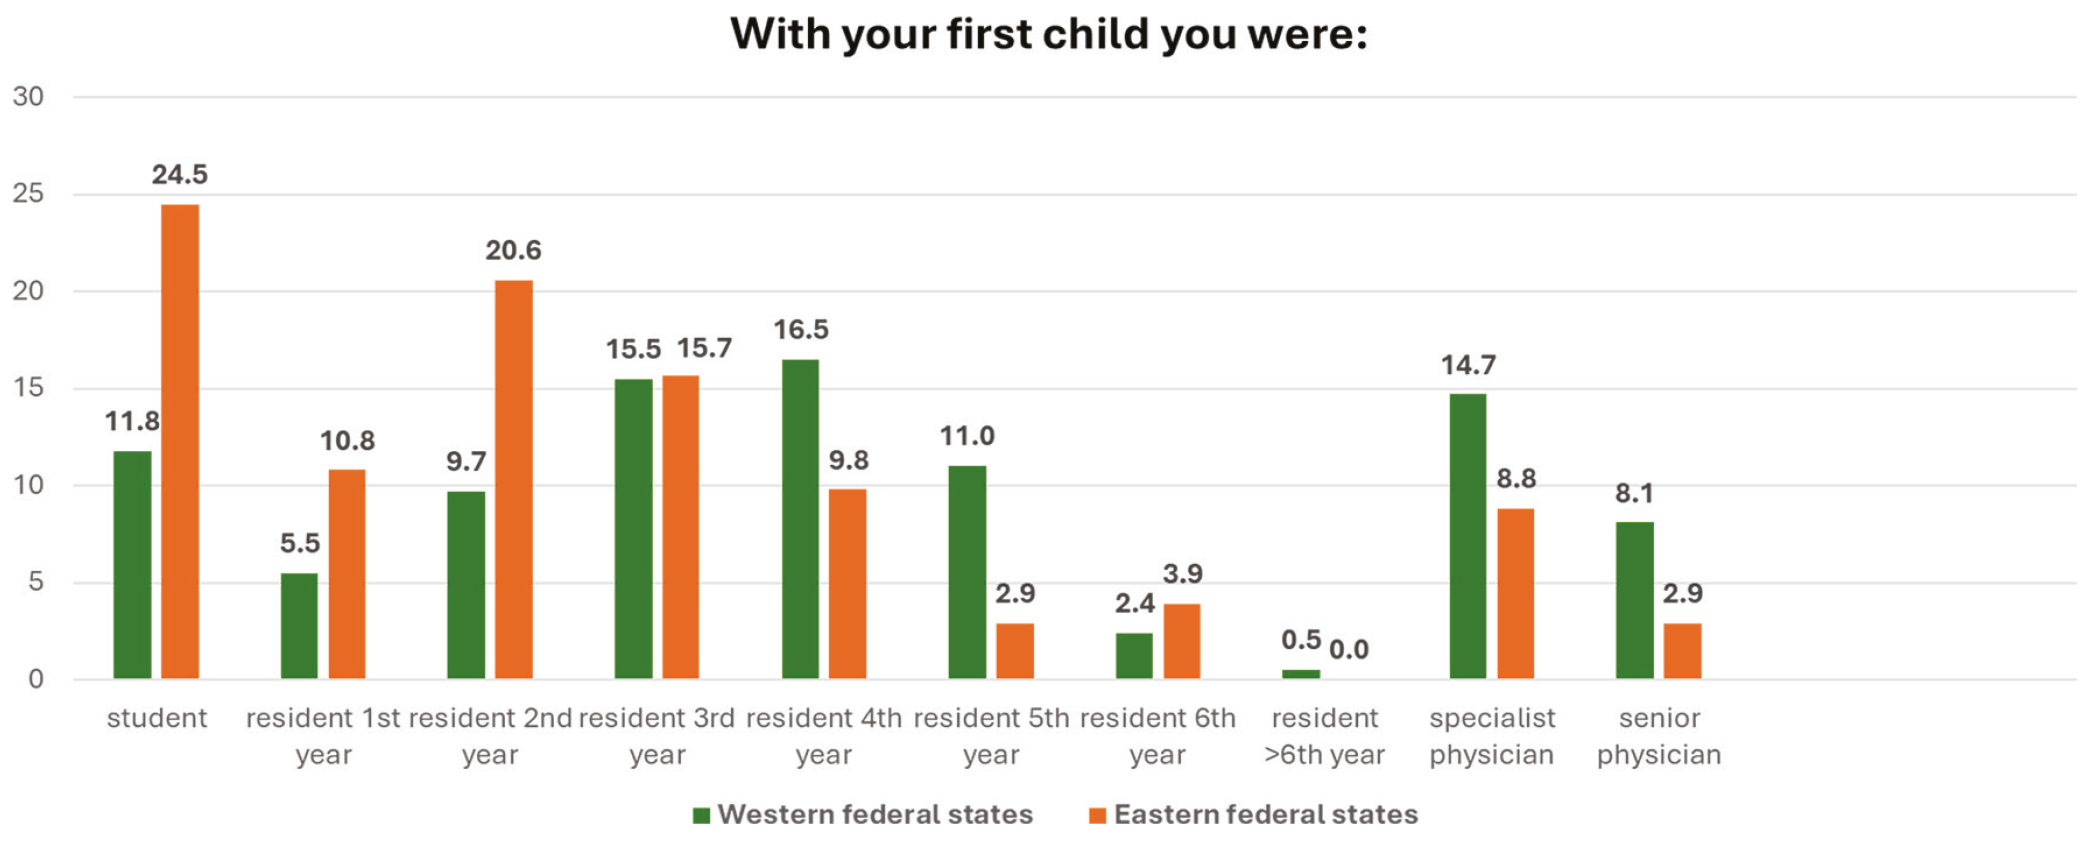
While the majority of participants from the East reported having children (63.0%), over 54.8% of participants from the West were childless (p<0.001). Parents from the West had a mean ± standard deviation of 1.9±0.86 children, while parents from the East had an average of 1.8±0.86 children. However, participants from the East became parents earlier (29.3±3.6 years) than those from the West (30.8±3.7 years). This is further illustrated by the fact that over 24.5% of parents from the East had children while still studying medicine (compared to 11.8% in the West). Overall, 71.6% of parents in the East had their first child by the end of their third year of specialty training, compared to only 42.5% of parents in the West (). A total of 33 mothers (7.4%) took family leave for up to a maximum of five months per child, while 11 mothers (2.5%) did not take any family leave. Among fathers, 21 individuals (53.8%) did not take any family leave, while 12 (30.7%) took a short family leave of up to five months. While mothers in both the East and West claimed parental leave at similar rates, differences were observed in the parental leave taken by fathers with 10.1% of respondents from Western federal states reported that fathers did not take family leave compared to 16.5% from the East. However, the proportion of those stating that over 80% of fathers take family leave was similar (9.8% in the West and 10.5% in the East).
Although a nearby childcare facility is a factor in the choice of workplace for both East and West, the number of participants naming it an influencing factor was significantly higher in the West (80.4%) than in the East (69.0%; p=0.002) ().
Table 3. Analysis of the questions on the topic: family time-off and childcare, categorized by federal state
Questions | Total*: n (%) | Western part of Germany | Eastern part of Germany | p-value |
|---|---|---|---|---|
Do you have children? | 1019 (100.0) | 854 (83.8) | 165 (16.2) | <0.001 |
Yes | 490 (48.1) | 386 (45.2) | 104 (63.0) | - |
No | 529 (51.9) | 468 (54.8) | 61 (37.0) | - |
With your first child you were (1) | 483 (100.0) | 381 (78.9) | 102 (21.1) | <0.001 |
Student | 86 (17.8) | 61 (11.8) | 25 (24.5) | - |
Resident 1st year | 32 (6.6) | 21 (5.5) | 11 (10.8) | - |
Resident 2nd year | 58 (12.0) | 37 (9.7) | 21 (20.6) | - |
Resident 3rd year | 75 (15.5) | 59 (15.5) | 16 (15.7) | - |
Resident 4th year | 73 (15.1) | 63 (16.5) | 10 (9.8) | - |
Resident 5th year | 45 (9.3) | 42 (11.0) | 3 (2.9) | - |
Resident 6th year | 13 (2.7) | 9 (2.4) | 4 (3.9) | - |
Resident >6th year | 2 (0.2) | 2 (0.5) | 0 (0.0) | - |
Specialist physician | 65 (13.5) | 56 (14.7) | 9 (8.8) | - |
Senior physician | 34 (7.0) | 31 (8.1) | 3 (2.9) | - |
Chief physician | 0 (0.0) | - | - | - |
Gynaecologist in outpatient practice | 0 (0.0) | - | - | - |
How long did you not work after giving birth? (1) (for multiple children with different time off, please use multiple answers) | 483 (100.0) | 381 (78.9) | 102 (21.1) | 0.028 |
2 years per child | 29 (6.0) | 25 (6.6) | 4 (3.9) | - |
1-2 years per child | 175 (36.2) | 133 (34.9) | 42 (41.2) | - |
9-12 months per child | 200 (41.4) | 150 (39.4) | 50 (49.0) | - |
6-8 months per child | 50 (10.4) | 45 (11.8) | 5 (4.9) | - |
3-5 months per child | 18 (3.7) | 17 (4.5) | 1 (1.0) | - |
<3 months per child | 28 (5.8) | 26 (6.8) | 2 (2.0) | - |
You did not take any family leave | 32 (6.6) | 26 (6.8) | 6 (5.9) | - |
Other option (please specify) | 25 (5.2) | 20 (5.2) | 5 (4.9) | - |
Do you want to become a parent in the future? (2) | 529 (100.0) | 468 (88.5) | 61 (11.5) | 0.06 |
Yes | 432 (81.7) | 388 (82.9) | 44 (72.1) | - |
No | 33 (6.2) | 29 (6.2) | 4 (6.6) | - |
You are not sure yet | 64 (12.1) | 51 (10.9) | 13 (21.3) | - |
How long would you like to pause work after the birth of your child as a parent? (2) | 496 (100.0) | 439 (88.5) | 57 (11.5) | 0.483 |
2 years per child | 11 (2.2) | 10 (2.3) | 1 (1.8) | - |
1-2 years per child | 127 (25.6) | 114 (26.0) | 13 (22.8) | - |
9-12 months per child | 171 (34.5) | 150 (34.2) | 31 (36.8) | - |
6-8 months per child | 79 (15.9) | 69 (15.7) | 10 (17.5) | - |
3-5 months per child | 30 (6.0) | 30 (6.8) | 0 (0.0) | - |
<3 months per child | 9 (1.8) | 8 (1.8) | 1 (1.8) | - |
You do not want to take any family leave | 3 (0.6) | 3 (0.7) | 3 (0.7) | - |
You are not sure yet | 66 (13.3) | 55 (12.5) | 11 (19.3) | - |
What percentage of mothers in your department take family leave? (3) | 816 (100.0) | 683 (82.6) | 133 (17.4) | 0.244 |
100->80% | 598 (73.3) | 500 (73.2) | 98 (73.7) | - |
>60-80% | 55 (6.7) | 49 (7.2) | 6 (4.5) | - |
>40-60% | 31 (3.8) | 28 (4.1) | 3 (2.3) | - |
>20-40% | 19 (2.3) | 17 (2.5) | 2 (1.5) | - |
1-20% | 20 (2.5) | 13 (1.9) | 7 (5.3) | - |
Mothers don’t take family leave at your department | 9 (1.1) | 7 (1.0) | 2 (1.5) | - |
You do not know | 80 (9.8) | 65 (9.5) | 15 (11.3) | - |
There are no mothers at your department | 4 (0.5) | 4 (0.6) | 0 (0.0) | - |
What percentage of fathers in your department take family leave? (3) | 816 (100.0) | 683 (83.7) | 133 (16.3) | 0.017 |
100->80% | 81 (9.9) | 67 (9.8) | 14 (10.5) | - |
>60-80% | 68 (8.3) | 59 (8.6) | 9 (6.8) | - |
>40-60% | 72 (8.8) | 63 (9.2) | 9 (6.8) | - |
>20-40% | 82 (10.0) | 78 (11.4) | 4 (3.0) | - |
1- 20% | 131 (16.1) | 114 (16.7) | 17 (12.8) | - |
Fathers don’t take family leave at your hospital | 91 (11.2) | 69 (10.1) | 22 (16.5) | - |
You do not know | 175 (21.4) | 140 (20.5) | 35 (26.3) | - |
There are no fathers at your department | 116 (14.2) | 93 (13.6) | 23 (17.3) | - |
Family leave at your workplace (university) is supported | 946 (100.0) | 799 (84.5) | 147 (15.5) | 0.607 |
Do not agree at all | 57 (6.0) | 50 (6.3) | 7 (4.8) | - |
Largely disagree | 70 (7.4) | 55 (6.9) | 15 (10.2) | - |
Rather disagree | 145 (15.3) | 125 (15.6) | 20 (13.6) | - |
Neither | 201 (21.2) | 174 (21.8) | 27 (18.4) | - |
Rather agree | 194 (20.5) | 165 (20.7) | 29 (19.7) | - |
Largely agree | 196 (20.7) | 163 (20.4) | 33 (22.4) | - |
Strongly agree | 83 (8.8) | 67 (8.4) | 16 (10.9) | - |
In your opinion, after what period of time does a “career break” occur for parents on family leave? | 946 (100.0) | 799 (84.5) | 147 (15.5) | 0.198 |
From 3-6 months | 70 (7.4) | 64 (8.0) | 6 (4.1) | - |
From 6-9 months | 180 (19.0) | 157 (19.6) | 23 (15.6) | - |
From 9-12 months | 167 (17.7) | 143 (17.9) | 24 (16.3) | - |
From 1-2 years | 217 (22.8) | 176 (22.0) | 41 (27.9) | - |
From >2 years | 81 (8.6) | 63 (7.9) | 18 (12.2) | - |
Family leave does not cause a career break | 31 (3.3) | 27 (3.4) | 4 (2.7) | - |
Family leave causes a career break regardless of the duration | 200 (21.1) | 169 (21.2) | 31 (21.1) | - |
The optimal time to become a parent is for you | 916 (100.0) | 771 (84.2) | 145 (15.8) | 0.589 |
During medical school | 65 (7.1) | 55 (7.1) | 10 (6.9) | - |
During specialty training | 190 (20.7) | 155 (20.1) | 35 (24.1) | - |
As a medical specialist | 198 (21.6) | 166 (21.5) | 32 (22.1) | - |
As a senior (leading) physician | 34 (3.7) | 32 (4.2) | 2 (1.4) | - |
As a chief physician | 1 (0.1) | 1 (0.1) | 0 (0.0) | - |
As a physician in outpatient practice | 5 (0.5) | 5 (0.6) | 0 (0.0) | - |
There is no optimal time | 423 (46.2) | 357 (46.3) | 66 (45.5) | - |
Does your place of work/university provide childcare with flexible hours and sufficient capacity? | 909 (100.0) | 764 (84.0) | 145 (16.0) | 0.056 |
Yes | 115 (12.7) | 90 (11.8) | 25 (17.2) | - |
No | 639 (70.3) | 536 (70.2) | 103 (71.0) | - |
You do not know | 155 (17.1) | 138 (18.1) | 17 (11.7) | - |
Would childcare close to the workplace be a factor when choosing an employer? | 909 (100.0) | 764 (84.0) | 145 (16.0) | 0.002 |
Yes, this would influence my choice of employer | 714 (78.5) | 614 (80.4) | 100 (69.0) | - |
No, it does not matter | 195 (21.5) | 150 (19.6) | 45 (31.0) | - |
Only respondents with children were asked this question
Only respondents without children were asked this question
Only respondents who work in hospitals were asked this question
*The differing number of total responses per question is due to the fact that participants were able to skip questions or prematurely end the survey
Preferred working time models
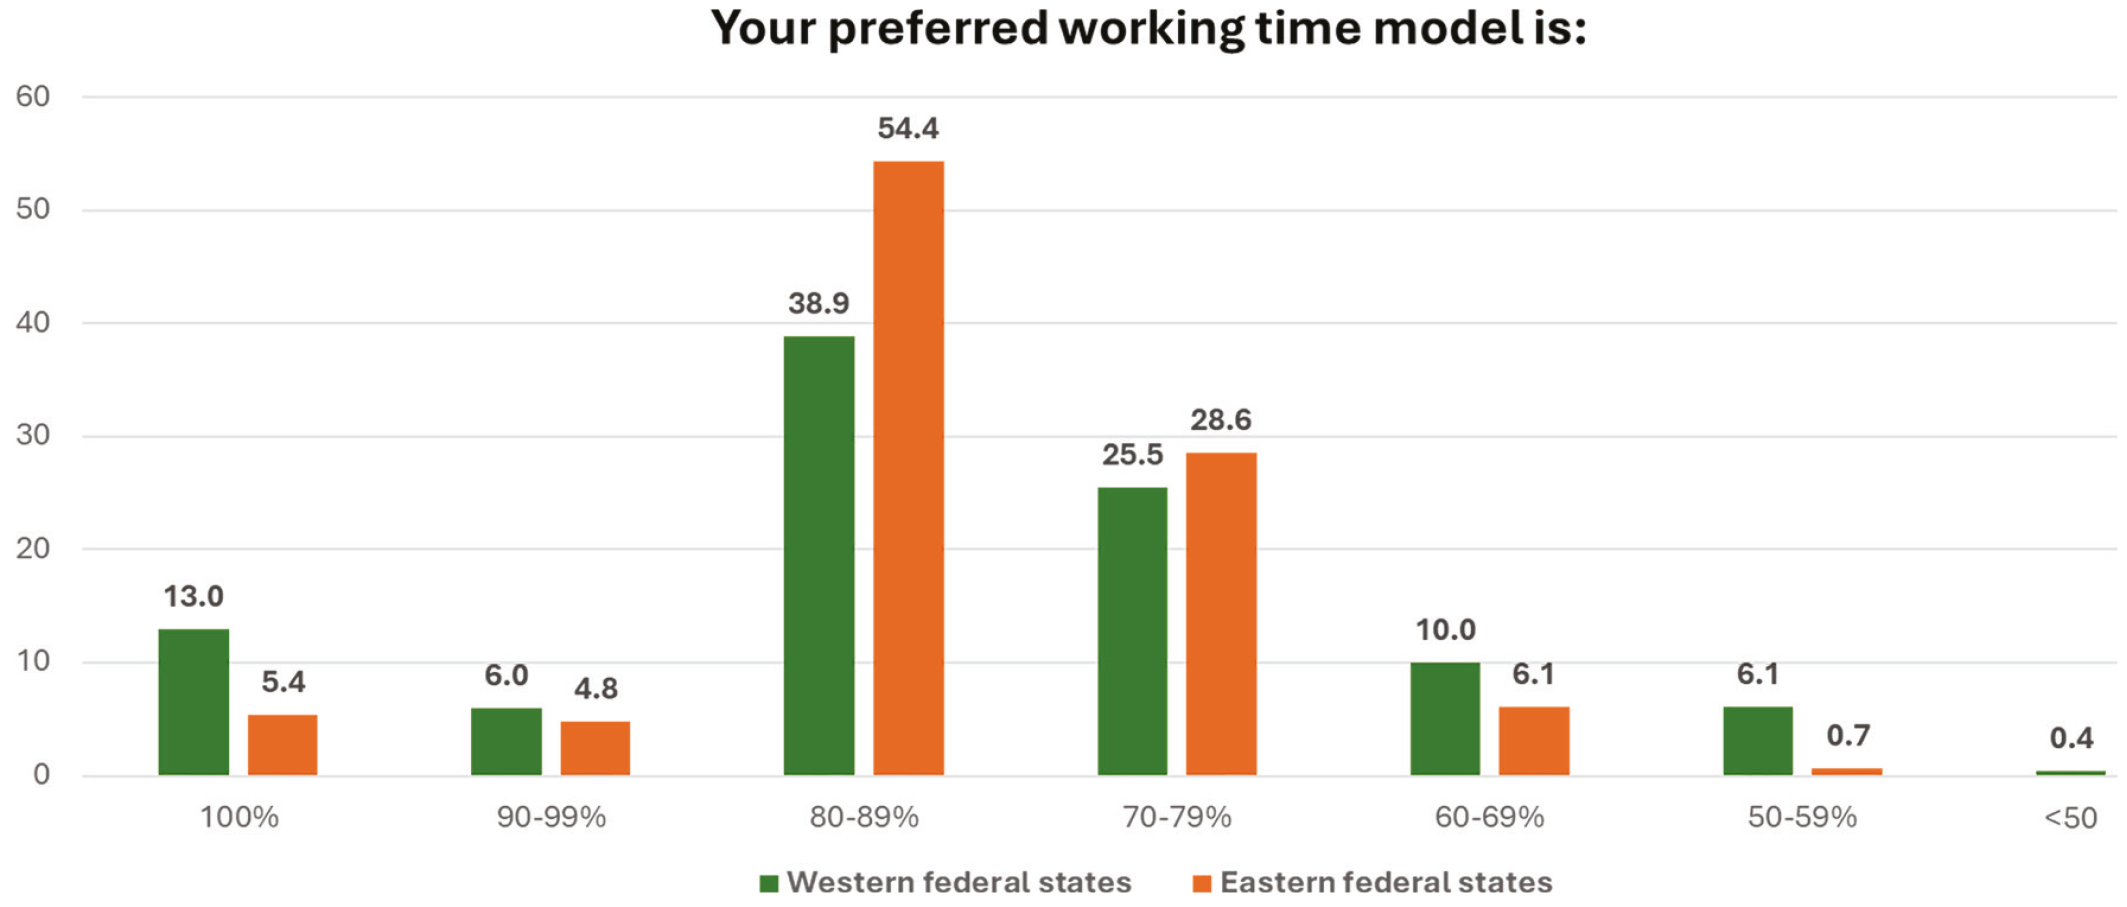
Significant differences were observed in both work-time preferences and current working hours between East and West. In the West, 13.0% of respondents preferred a full-time position, compared to only 5.4% in the East (p<0.001). Although an 80-89% work schedule is the most popular model in both the Western and Eastern federal states, the approval in the East was significantly higher at 54.4% compared to 38.9% in the Western federal states (). In contrast, the proportion of those reporting part-time work with <70% of full-time hours as the preferred model was higher in the West than in the East (13.9% vs. 9.1%).
When divided by gender, significant differences persisted in both the preferred working time models and the current working time model. While 10.4% of female participants from the West prefer a full-time position, only 3.5% of female participants from the East favored this option. Conversely, 7.0% of female participants in the East and 14.6% of female participants from the West prefer a position with less than 70% of full-time hours (p<0.001). However, no significant differences were found among male participants regarding preferred working time models between East and West (p=0.530).
Significant differences were also found among female participants regarding their current working time models. While 48.1% of female participants in the West work full-time, only 40.8% do so in the East. However, significantly fewer female participants in the East hold a position with less than 70% of full-time hours (7.7% in the East vs. 16.1% in the West; p<0.001). Once again, no significant differences were observed among male participants (p=0.759).
Currently, 52.1% participants in the West work full-time, compared to 41.5% in the East. Consequently, the proportion of part-time workers was significantly higher in the East than in the West (p<0.001). Regarding solutions to avoid staffing burdens due to part-time work, the model “part-time employees work exclusively full days with fixed days off” was more popular in the West (56.9%), while job sharing with shift splitting (48.5%) was favored more in the East (p=0.007) ().
Table 4. Analysis of the questions on the topic: working time models/part-time employment, categorized by federal state
Questions | Total*: n (%) | Western part of Germany | Eastern part of Germany | p-value |
|---|---|---|---|---|
Your preferred working time model is | 946 (100.0) | 799 (84.5) | 147 (15.5) | <0.001 |
100% | 112 (11.8) | 104 (13.0) | 8 (5.4) | - |
90-99% | 55 (5.8) | 48 (6.0) | 7 (4.8) | - |
80-89% | 391 (41.3) | 311 (38.9) | 80 (54.4) | - |
70-79% | 246 (26.0) | 204 (25.5) | 42 (28.6) | - |
60-69% | 89 (9.4) | 80 (10.0) | 9 (6.1) | - |
50-59% | 50 (5.3) | 49 (6.1) | 1 (0.7) | - |
<50% | 3 (0.3) | 3 (0.4) | 0 (0.0) | - |
Your current working time model is | 946 (100.0) | 799 (84.5) | 147 (15.5) | <0.001 |
100% | 477 (50.4) | 416 (52.1) | 61 (41.5) | - |
90-99% | 23 (2.4) | 14 (1.8) | 9 (6.1) | - |
80-89% | 134 (14.2) | 96 (12.0) | 38 (25.9) | - |
70-79% | 69 (7.3) | 58 (7.3) | 11 (7.5) | - |
60-69% | 62 (6.6) | 58 (7.3) | 4 (2.7) | - |
50-59% | 51 (5.4) | 44 (5.5) | 7 (4.8) | - |
<50% | 15 (1.9) | 0 (0.0) | 15 (1.6) | - |
You are currently on maternity leave | 24 (2.5) | 20 (2.5) | 4 (2.7) | - |
You are currently on family leave as a parent | 36 (3.8) | 29 (3.6) | 7 (4.8) | - |
You are currently looking for work/not yet employed | 55 (5.8) | 49 (6.1) | 6 (4.1) | - |
Your reasons for working part-time are (1): (multiple answers possible) | 732 (100.0) | 582 (79.5) | 150 (20.5) | 0.116 |
Caring for children | 264 (75.9) | 218 (78.1) | 46 (66.7) | - |
Caring for relatives | 12 (3.4) | 10 (3.6) | 2 (2.9) | - |
Desire for a better work-life balance | 210 (60.3) | 161 (57.7) | 49 (71.0) | - |
Too extensive workload | 172 (49.4) | 133 (47.7) | 39 (56.5) | - |
Time needed for academic work | 31 (1.4) | 26 (9.3) | 5 (7.2) | - |
Other: (please specify) | 43 (2.6) | 34 (12.2) | 9 (13.0) | - |
What solutions would you propose for avoiding a possible personnel burden due to part-time workers? (2) (multiple answers possible) | 447 (100.0) | 399 (89.3) | 48 (10.7) | 0.007 |
Fixed job sharing (2 physicians each 50% with duty splitting) | 158 (49.2) | 142 (49.3) | 16 (48.5) | - |
Part-time employees work exclusively full days with fixed days off | 177 (55.1) | 164 (56.9) | 13 (39.4) | - |
I do not know | 81 (25.2) | 65 (22.6) | 16 (48.5) | - |
Other (please specify) | 31 (9.7) | 28 (9.7) | 3 (9.1) | - |
Only part-time workers were asked this question
Only full-time workers were asked this question
*The differing number of total responses per question is due to the fact that participants were able to skip questions or prematurely end the survey
Discussion
Regarding childcare and the compatibility of career and family, the data presented here indicate that gynecology physicians employed in the Eastern part of Germany become parents earlier than those in the West. This is further reflected in a higher proportion of those becoming parents during medical school and/or early medical training positions in the East. In addition, the childlessness rate among gynecologists is lower in the East than in the West. Overall, these findings correlate with current general population data from Germany, which show that women in the East become mothers earlier and that childlessness is more common in the West. Among women from the Western federal states, the childlessness rate is approximately eight percentage points higher both at the end and during the fertile phase (). The fact that absolute birth rates ultimately differ little between East and West is primarily due to the higher rate of mothers with only one child in the East, whereas in the West, women are more often mothers of multiple children.
Notably, significant differences in decision-making regarding having children among highly qualified women were reported. Overall, the childlessness rate among highly qualified academics (31.3%) is significantly higher than among women with lower educational qualifications (17.4%). While the average number of children among women in the West differs significantly by professional qualification (1.3 children for academics; 1.6 children for non-academics), no education-specific trend is observed in the East ().
Based on the data presented here, no significant differences were found in the frequency of parental leave taken by gynecologist mothers. However, significant differences were observed among gynecologist fathers with more fathers claiming parental leave in the West. In the general population, however, fathers from Eastern federal states take parental leave more frequently than those in the West ().
Contrary to general population data, preferences and actual working time models also differed between East and West. According to the present analysis, a full-time position is not only preferred more often in the West than in the East, but overall, more gynecologists in the West also work full-time compared to those in the East. A report from the Economic and Social Science Institute from 2023 stated that only 33.2% of women in the East worked part-time, while in the West, nearly half of all women (47.8%) were employed part-time. Among men, the proportion of part-time workers was significantly lower (11.7%) with no differences between East and West ().
However, it is worth noting that participants of the FARBEN survey from the East were more frequently employed in non-university hospitals, where physicians in general are more likely to work part-time ().
While not significantly different, more participants from the East reported that their workplace offers sufficient and flexible childcare facilities (17.2% vs. 11.8% in the West). Regarding career choices, a childcare close to the workplace remains an important factor in the choice of employer, particularly in the West (80.4%) but less so in the East (69.0%). Although Germany has been reunified for over 30 years, childcare structures in the East still generally surpass those in the West. In the East, 73% of children aged three to six receive full-day care outside their home, compared to only 41% in the West ().
Despite these differences, it is important to acknowledge the progress made in expanding childcare facilities in the West. For example, the availability of full-day childcare in the West has doubled over the past 15 years (). The attitude of the German population toward non-family childcare for preschool-aged children has also significantly changed in recent years. While in 2005, 41% of people aged 18 to 50 years believed that young children suffer when their mothers are employed, this figure dropped to 23% in 2021 (). In comparison, in 1991 57% of women and 59% of men in East Germany shared this belief, compared to 73% and 79% in West Germany. In 2004 the approval rating declined for both men and women (23% of women and 35% of men in East Germany; 56% and 70% in West Germany, respectively) ().
Study limitations
To the best of our knowledge, the FARBEN survey is the largest survey regarding working time models and gender equality in gynecology. However, in this analysis, the Western part of Germany is overrepresented, with 855 participants (83.7%) compared to 166 participants from the East (16.2%). Participants from the city-state of Berlin (n=63; 38.0%) were counted among the Eastern participants. This categorization was controversially discussed within the project team and ultimately justified, as the most renowned hospital in Berlin, the Charité University Hospital, is located in the former East Berlin. In addition, the city-state of Berlin is either analyzed separately or attributed to the former East in other statistical analyses and publications concerning East vs. West, based on which distribution we were able to align ourselves with ().
Another important point to consider is that the survey in question focused solely on respondents’ current place of residence, without accounting for their place of upbringing. Following German reunification, population movements occurred in both directions between East and West, which are not reflected in the survey data but likely continue to exert a significant influence on individuals’ preferences.
In addition to assessing the availability of sufficient capacities for flexible childcare, it is important to critically evaluate and ensure the quality of childcare services. Accordingly, the implications of this paper should not be limited to considerations of quantity, but must also address the quality of childcare provision, situating both dimensions within a broader socio-historical context.
The reasons for the significantly higher number of participants from the Western federal states remain unclear. Generally, the FARBEN survey in Germany was conducted and promoted by a research team that operates mainly in the Western federal states (Schleswig-Holstein and Bavaria). At the time of the survey, only one physician in Berlin was involved in the working group, while all other members were working in the Western federal states, which may have influenced recruitment. Whether the absence of gynecologists from other Eastern federal states in the working group may have affected recruitment remains speculative.
Looking ahead, future studies could benefit from a longitudinal or repeated-measures design to better understand causal relationships between regional background, career preferences, and work-life balance. To improve generalizability, future surveys should aim for a more balanced or stratified sample across all federal states, possibly by involving a broader network of collaborators from Eastern regions. Furthermore, these findings can inform the development of more sustainable and regionally tailored working time models and childcare strategies, supporting gender equality and long-term career satisfaction in gynecology and obstetrics.
Conclusion
This study highlighted persistent regional differences in family planning, career preferences, and working time models among gynecologists in Germany, shaped by historical policy legacies. The findings underscore the importance of regionally tailored, flexible work structures and reliable childcare solutions to support work-family balance. To promote gender equality and long-term retention in gynecology, future efforts should prioritize sustainable, family-friendly workplace policies informed by both historical context and current needs.
The fundamentally different family policies in the former GDR and West Germany have lasting effects that are still felt today in both parts of the Federal Republic of Germany. The younger age of motherhood and lower rate of childlessness among female gynecologists in the East, as observed in our analysis, correspond to current birth rates in the population and the generally higher rate of childlessness among Western female academics.
Footnotes
Ethics Committee Approval: This study was approved by the University of Lübeck in Germany (approval number: 2023-644, date: 20.09.2023).
Informed Consent: By participating in the online survey, participants provided informed consent for their involvement in the study as well as for the anonymous publication of the resulting data.
Author Contributions: Concept: N.T., N.A., P.F., A.K., C.B., R.K., S.S., B.S., A.R., M.B.P., Design: N.T., N.A., P.F., A.K., C.B., R.K., B.S., A.R., M.B.P., Data Collection or Processing: N.T., N.A., P.F., A.K., C.B., R.K., M.B.P., Analysis or Interpretation: N.T., N.A., M.B.P., Literature Search: N.T., N.A., M.B.P., Writing: N.T., M.B.P., P.F., M.G., S.H., R.K., N.Kİ., A.K., N.K., L.D.M., G.N., A.R., H.S., L.S., B.S., S.S., M.WA., M.W., N.A.
Conflict of Interest: No conflict of interest is declared by the authors.
Financial Disclosure: The authors declared that this study received no financial support.
References
Tauber N, Amann N, Foessleitner P, Klee A, Becker C, Kiblawi R, et al. Preferred working time models and equal opportunities in gynecology and obstetrics: results of the systematic trinational FARBEN survey. GebFra. 2025; 85: 311-22.
Winder FM, Breuer G, Favero M, Foessleitner P, Friemann M, Krischer B, et al. Postgraduate medical education in obstetrics and gynaecology: where are we now and what do we need for the future? A study on postgraduate training in obstetrics and gynaecology in Germany, Austria and Switzerland. GMS J Med Educ. 2022; 39: Doc41.
Krischer B, Brechbühl-Litzel R, Breuer GD, Favero M, Foessleitner P, Friemann AM, et al. Postgraduate medical education in obstetrics and gynecology in Switzerland in comparison to Germany and Austria: the results of an international survey. Arch Gynecol Obstet. 2025; 311: 569-76.
Häussler B, Schmalfeldt B, Häussler S, Köninger A, Loos S, Naumann G, et al. National and international comparisons of gynecological research in Germany based on a bibliometric analysis of publications. Geburtshilfe Frauenheilkd. 2024; 84: 346-56.
Meister T, Foessleitner P, Breuer G, Winder FM, Favero M, Friemann M, et al. The impact of gender on the self-confidence of practical and surgical skills among OBGYN residents: a trinational survey. Arch Gynecol Obstet. 2024; 309: 2669-79.
Riedel M, Hennigs A, Dobberkau AM, Riedel C, Bugaj TJ, Nikendei C, et al. The role of gender-specific factors in the choice of specialty training in obstetrics and gynecology: results from a survey among medical students in Germany. Arch Gynecol Obstet. 2022; 305: 129-37.
Neuhold J, von Versen-Höynck F. Analyse zur gleichstellung der geschlechter in der frauenheilkunde in Deutschland. GebFra. 2024; 84: 188.
Domscheit Berg A. Familienpolitik in Ost- und Westdeutschland und ihre langfristigen Auswirkungen. Available online: https://www.boell.de/de/2016/11/09/familienpolitik-ost-und-westdeutschland-und-ihre-langfristigen-auswirkungen#Erwerbsbeteiligung%20als%20Folge%20von%20Familienpolitik (accessed on 17.02.25).
Bundesstiftung Aufarbeitung. Kindergärten. Available online: https://deutsche-einheit-1990.de/ministerien/mfbw/kiga/?utm_source=chatgpt.com (accessed on 17.02.25).
Nier H. Ostdeutsche Mütter sind häufiger berufstätig. Available online: https://de.statista.com/infografik/19529/ostdeutsche-muetter-sind-haeufiger-berufstaetig/ (accessed on 17.02.25).
Eysenbach, G. Improving the quality of web surveys: the checklist for reporting results of internet e-surveys (CHERRIES). J Med Internet Res. 2004; 6: e34.
Klee A, Amann N, Becker C, Fößleitner P, Krawczyk N, Kiblawi R, et al. Teilnahme-aufruf – favorisierte arbeitszeitmodelle in der gynäkologie – FARBEN-studie der jungen foren DGGG, OEGGG und SGGG. Geburtshilfe Frauenheilkd. 2023; 83: 1424-5.
DESTATIS Bundesamt. Kinderlosigkeit und mutterschaft. Available online: https://www.destatis.de/DE/Themen/Gesellschaft-Umwelt/Bevoelkerung/Geburten/kinderlosigkeit-und-mutterschaft.html?nn=208824#kinderlosigkeit%20im%20osten%20deutlich%20niedriger%20als%20im%20westen%20trotz%20annaeherung (accessed on 22.02.2025).
Bundesamt für Bevölkerungsforschung. Kinderzahl hängt von der Bildung ab – aber nur in Westdeutschland. Available online: https://www.bib.bund.de/DE/Presse/Mitteilungen/2012/2012-09-Kinderzahl-haengt-von-der-Bildung-ab---aber-nur-in-Westdeutschland.html (accessed on 22.02.2025).
Pfahl S, Unrau E. Elterngeldbezug in Deutschland 2008-2021. Available online: (accessed on 28.05.2025)
Pfahl S, Unrau E, Wittmann M, Lott Y. Stand der gleichstellung von frauen und männern auf den arbeitsmärkten in West- und Ostdeutschland? 2023.
Amann N, Banys-Paluchowski M, Becker C, Foessleitner P, Göpfert M, Kiblawi R, et al. Compability of family and clinical-scientific career for German gynecologists in different workplaces: a sub- analysis of the systematic trinational FARBEN Survey. 2025.
Bundesinstitut für Bevölkerungsforschung. Rollenbild im wandel: berufstätigkeit von müttern wird gesellschaftlich zunehmend akzeptiert. Available online: https://www.bib.bund.de/DE/Presse/Mitteilungen/2024/2024-04-29-Rollenbild-im-Wandel-Berufstaetigkeit-von-Muettern-wird-gesellschaftlich-zunehmend-akzeptiert.html (accessed on 22.02.2025).
Dähner S, Heiermann A, Sütterlin S, Slupina M, Sixtus F, Vielfalt der Einheit. Wo Deutschland nach 30 Jahren zusammengewachsen ist. 2020.
Supplementary Materials
Appendix 1
Download